Effective logging is a cornerstone of modern application observability, enabling developers and operations teams to monitor performance, troubleshoot issues, and gain insights into system behaviour. As applications grow in scale and complexity, traditional logging systems often fall short in terms of performance, flexibility, and scalability. OpenTelemetry offers a robust solution for setting up a scalable logging system that integrates seamlessly with metrics and traces, providing a holistic observability platform.
In this blog post, we’ll walk through the steps to set up a scalable logging system using OpenTelemetry.
What is OpenTelemetry?
OpenTelemetry is an open-source observability framework for generating, collecting, and exporting telemetry data such as logs, metrics, and traces. It is supported by the Cloud Native Computing Foundation (CNCF) and has become a standard in the industry for observability.
The key features of OpenTelemetry include:
- Vendor-neutrality: Use the backend of your choice (e.g., Elasticsearch, Splunk, Prometheus, or others).
- Unified observability: Combine logs, metrics, and traces for comprehensive insights.
- Extensibility: Add custom instrumentation or plugins to meet specific needs.
Why Use OpenTelemetry for Logging?
Here are some advantages of using OpenTelemetry for logging:
| Flexibility: Supports multiple programming languages and frameworks. |
| Scalability: Designed to handle high-throughput data collection and export. |
| Integration: Easily integrates with various open-source and commercial backends. |
| Consistency: OpenTelemetry ensures consistent data formats and tagging across logs, metrics, and traces. |
Setting Up OpenTelemetry Logging
Let’s dive into the steps to set up a scalable logging system with OpenTelemetry.
1. Install OpenTelemetry SDK and Collector
Start by installing the OpenTelemetry SDK for your programming language. For example, in Python, you can install the SDK as follows:
pip install opentelemetry-sdk opentelemetry-exporter-otlpFor other languages like Java, JavaScript, or Go, follow the installation instructions in the OpenTelemetry documentation.
The OpenTelemetry Collector is a key component for processing and exporting telemetry data. Download and configure the collector from the OpenTelemetry GitHub repository.
2. Configure the OpenTelemetry SDK
Configure the OpenTelemetry SDK to enable logging. Below is an example of how to configure it in Python:
from opentelemetry import logs
from opentelemetry.sdk.logs import LogEmitterProvider
from opentelemetry.sdk.logs.export import BatchLogRecordProcessor, OTLPLogExporter

# Initialize the log emitter provider
log_emitter_provider = LogEmitterProvider()
logs.set_log_emitter_provider(log_emitter_provider)

# Configure OTLP exporter
exporter = OTLPLogExporter(endpoint="http://localhost:4317")
processor = BatchLogRecordProcessor(exporter)
log_emitter_provider.add_log_record_processor(processor)

# Create a logger
logger = logs.get_logger(__name__)

# Emit a log
logger.info("This is a test log message")
3. Set Up the OpenTelemetry Collector
The OpenTelemetry Collector processes telemetry data and exports it to your chosen backend. Use a configuration file to specify the pipelines for logs, metrics, and traces. Here is an example configuration:
receivers:
  otlp:
    protocols:
      grpc:
      http:

exporters:
  logging:
    loglevel: debug
  otlp:
    endpoint: <your-backend-endpoint>

service:
  pipelines:
    logs:
      receivers: [otlp]
      exporters: [logging, otlp]
Run the collector using the following command:
otelcol --config config.yaml4. Choose a Backend
Select a backend to store and analyze your logs. Common choices include:
| Elasticsearch: For flexible log querying and visualization with Kibana. |
| Splunk: For advanced analytics and real-time monitoring. |
| Grafana Loki: Lightweight log aggregation tailored for Grafana users. |
Configure the OpenTelemetry Collector to export logs to your chosen backend.
5. Monitor and Scale
To ensure your logging system scales effectively:
| Optimise batch sizes and timeouts: Adjust these settings in the SDK and collector to handle high data throughput efficiently. |
| Use horizontal scaling: Deploy multiple instances of the OpenTelemetry Collector behind a load balancer. |
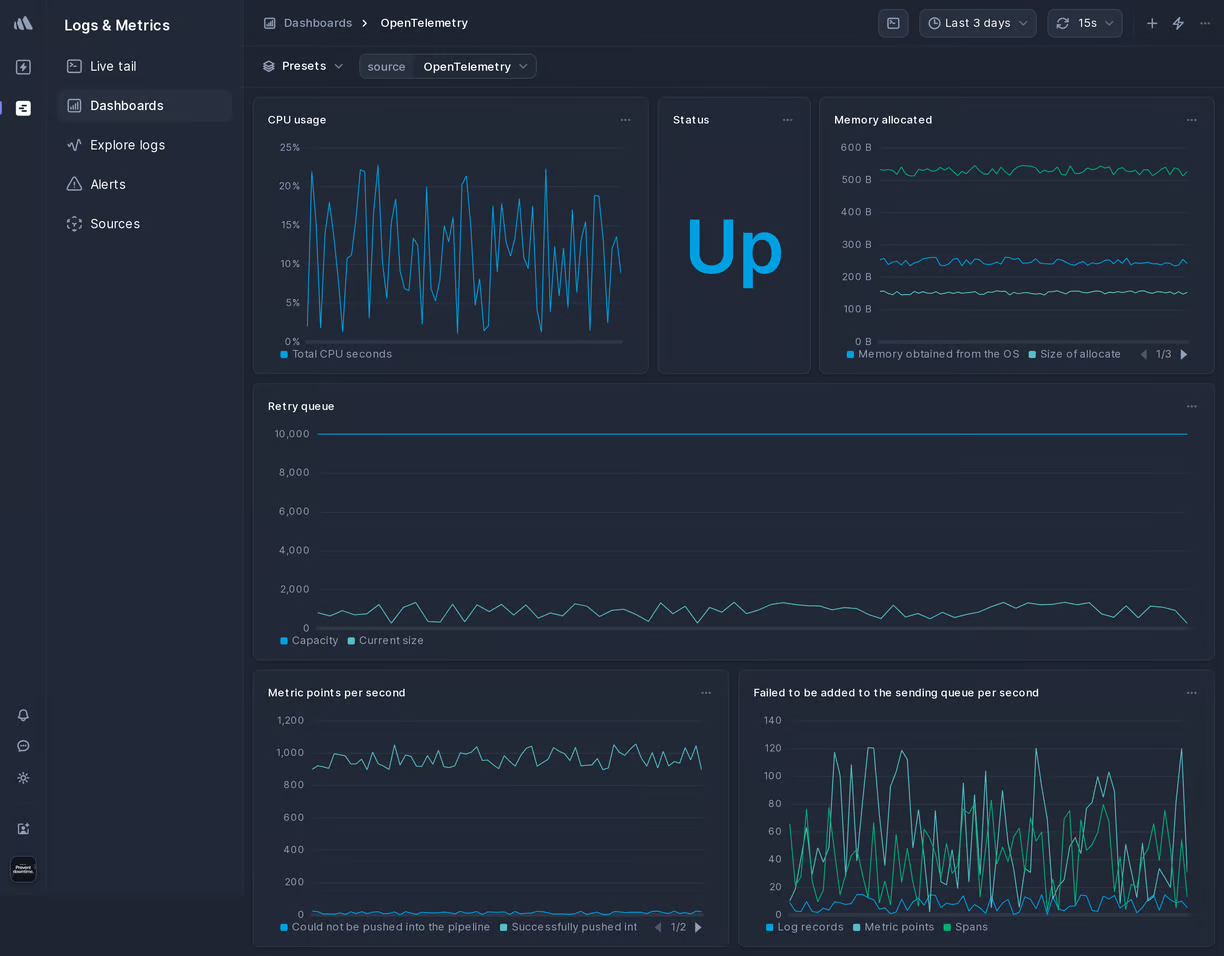
| Monitor performance: Use dashboards to track telemetry data ingestion, processing latency, and backend performance. |
Conclusion
Setting up a scalable logging system with OpenTelemetry ensures consistent, high-performance observability across your applications. By integrating logs with metrics and traces, you gain a unified view of your system, enabling faster troubleshooting and better decision-making.
Ready to get started? Explore the OpenTelemetry documentation and elevate your observability game today!